


Presentations are a big part of how many victim service providers (VSPs) reach their communities -- whether through prevention education, awareness sessions, or outreach events. In StriveDB, you can log each presentation in a way that makes grant reporting and program evaluation seamless.
This post walks you through how to enter a presentation from start to finish, including audience demographics and funding data.
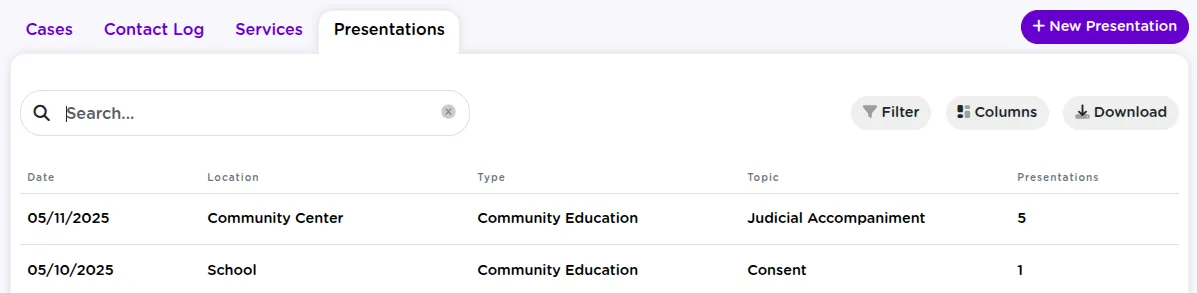
Accessing the Presentations Section
To begin, head to the Advocacy tab in the left-hand menu, then click Presentations. This opens a table showing all previously logged presentations.
Starting a New Presentation Log
Click the "New Presentation" button to begin a new entry. This will open the first part of the form.
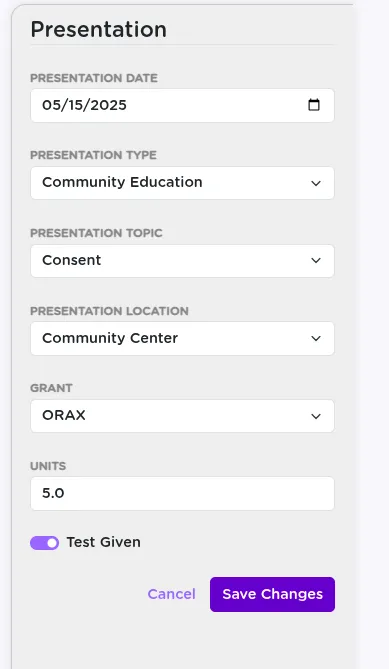
Entering Presentation Details: Date, Type, Topic, and Grant
In the first step, you will log the basic event details:
- Date of the presentation
- Type -- such as primary prevention, outreach, or training
- Topic -- for example, healthy relationships, consent, or boundaries
- Location -- where the presentation took place (such as a workplace or school)
- Grant -- indicate which grant funded the event
- Units of service -- number of presentations or hours
- Pre/post test -- whether a test was given before, after, or both
Proceeding to the Presentation Detail Page
Click Next to land on the specific Presentation Detail Page. This is where you will enter attendance and presenter information.
Adding Audience and Presenter Information
On this screen, fill out:
- Number of attendees
- Total presentations given (for that event)
- Providers -- who gave the presentation (mark primary vs. support)
- Remarks -- any additional notes or context
Recording presenters helps connect the work to staff service logs and ensures credit for participation is tracked consistently.
Recording Audience Demographics for Grant Reporting
This is one of the most important steps for grant reporting.
- For each unique combination of gender, race, ethnicity, and age range, add a new row
- Enter the number of participants that match that combination
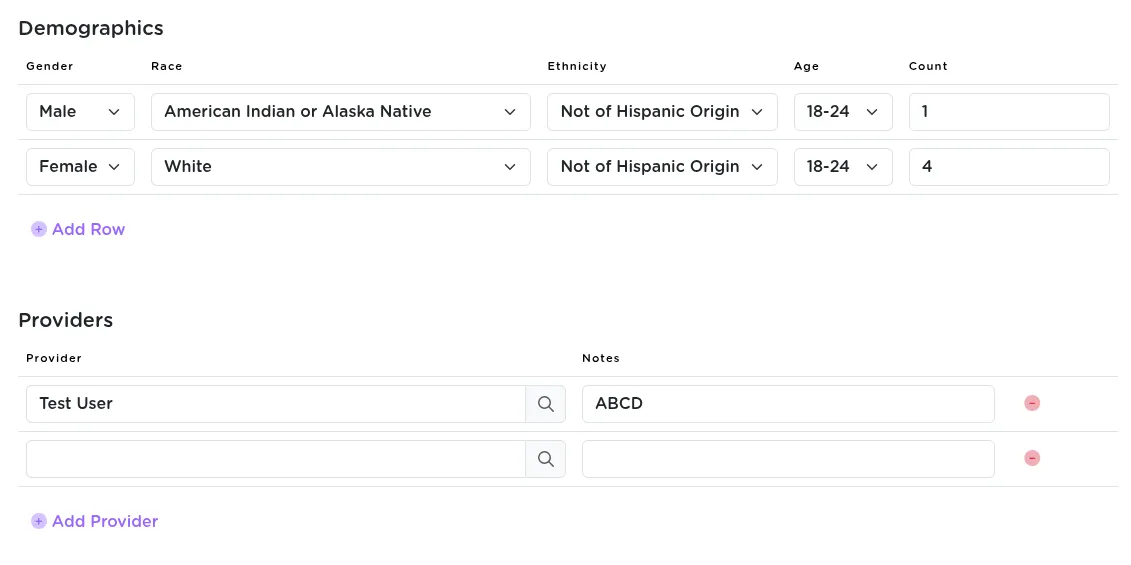
Entering full demographics here supports accurate grant submissions without needing extra spreadsheets later.
Saving and Reviewing the Presentation Summary
Once everything is entered, click Save. StriveDB will show a summary view with:
- Total attendees
- Number of presentations
- Demographic breakdown table
Key Takeaways
The Presentations tool in StriveDB makes it simple to document outreach, track provider involvement, and stay grant-compliant. Whether it is a one-time event or part of a long-term series, each presentation you log helps paint a clearer picture of your organization's impact.
Want help building custom presentation types or simplifying demographic input? Reach out to support and we will help configure it to fit your workflow.